
LLM Traffic Grew 2.4x by Q3 2026. Here's Where It Landed on 34 B2B SaaS Sites
Where did ChatGPT, Gemini, Claude, Perplexity and Copilot send their visitors in Q3 2026? TripleDart analyzed 16,521 landing pages across 34 B2B SaaS brands to find the answer.
Contributor

Akilan Arumugam
SEO Specialist
In this article
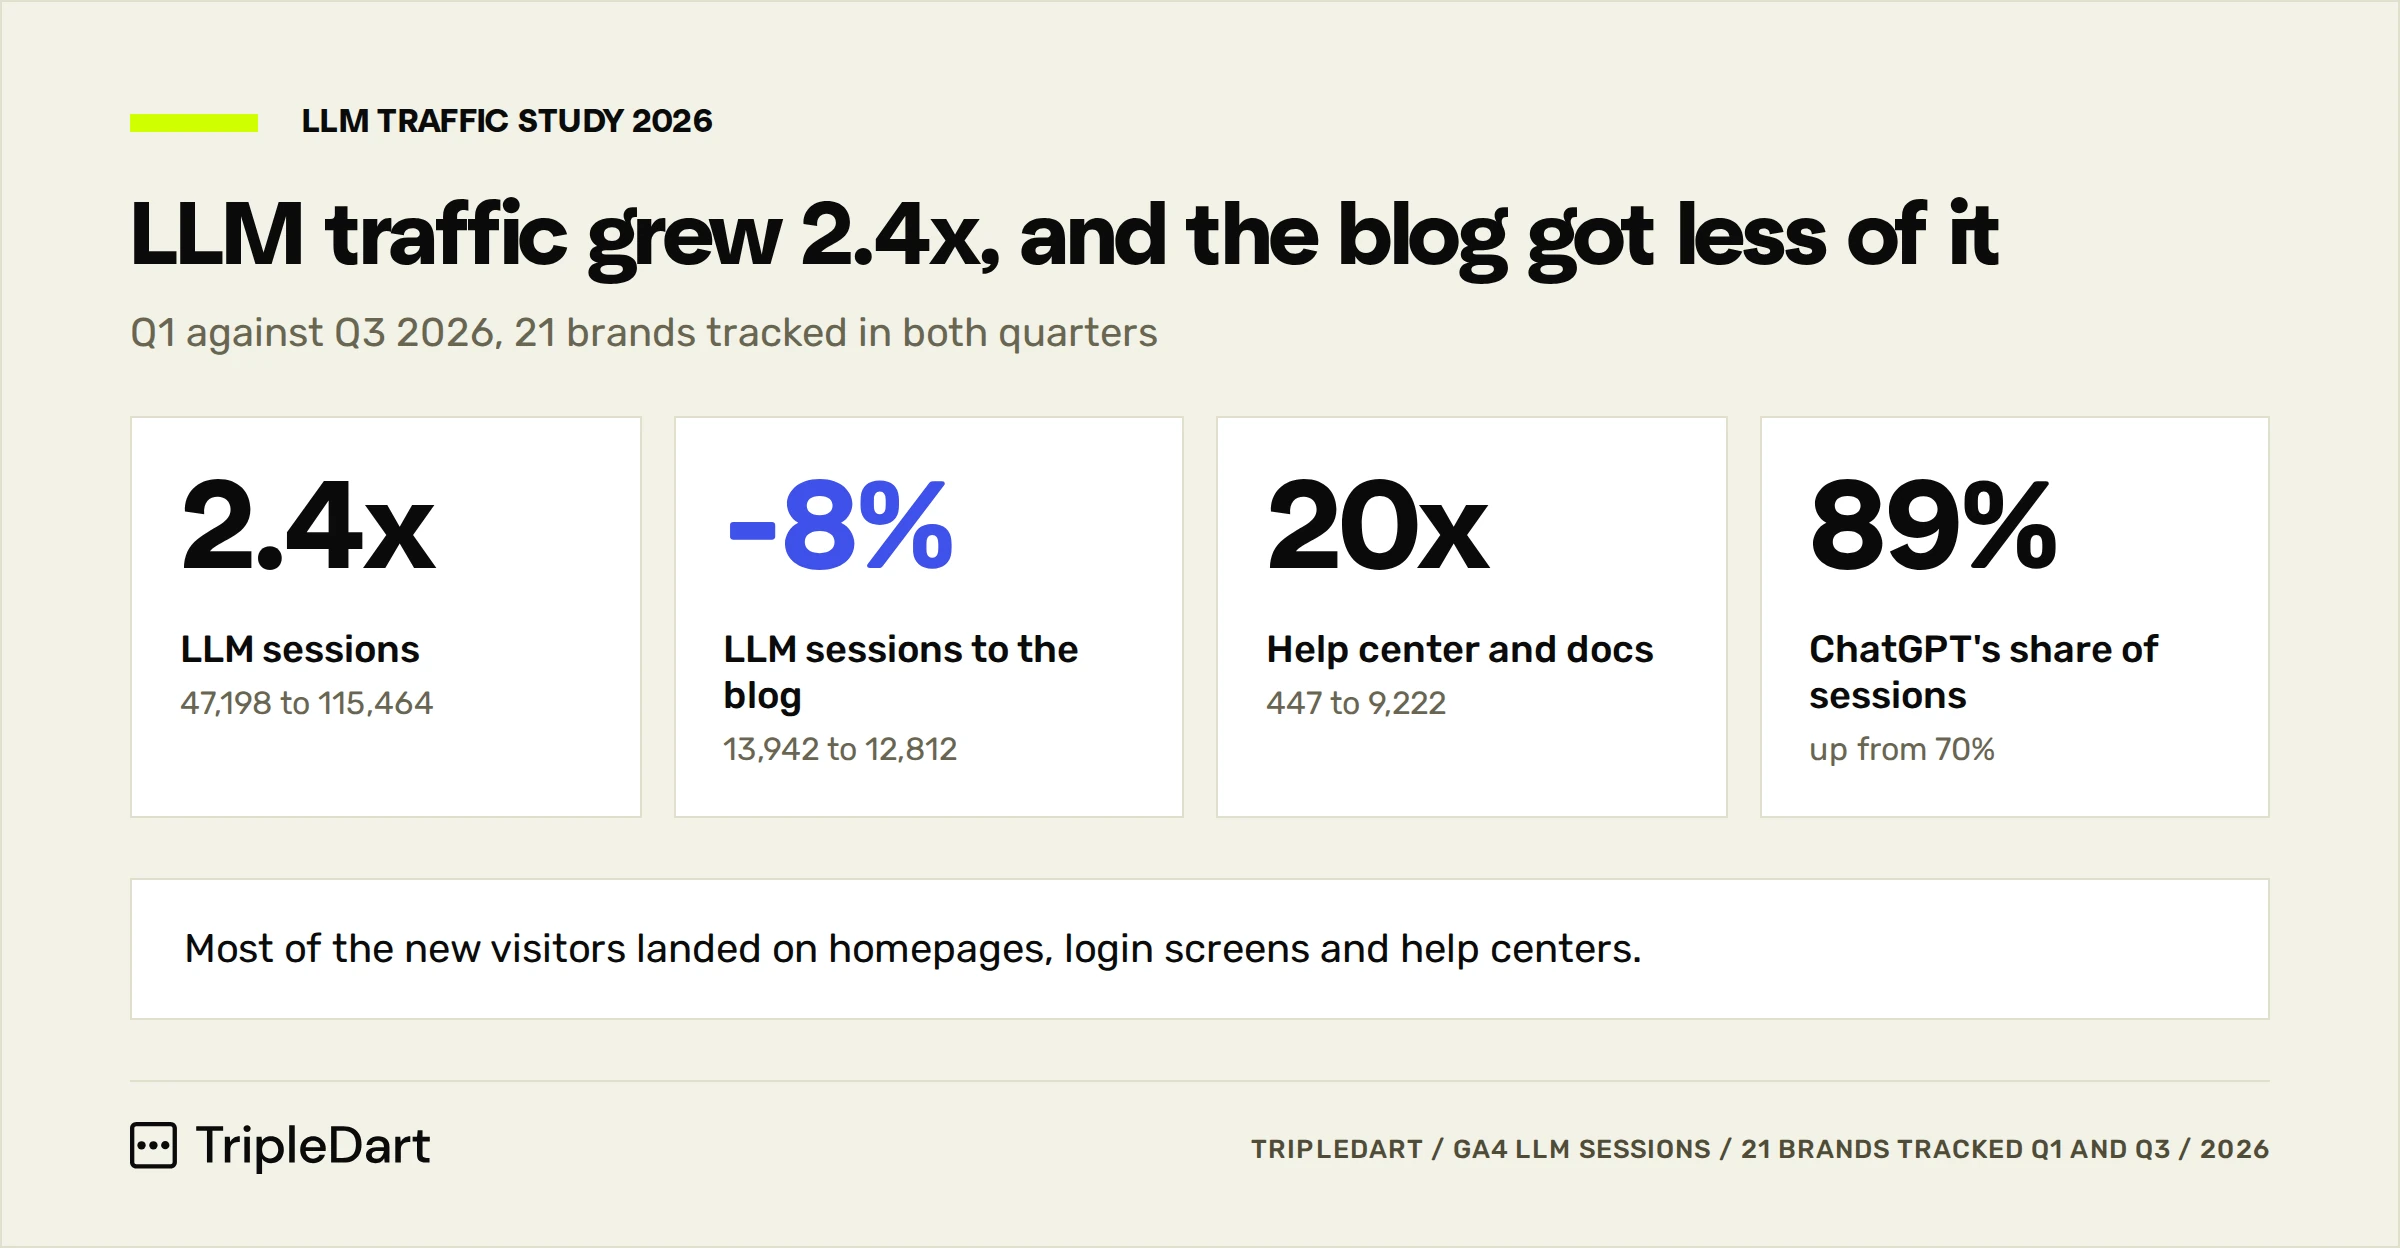
Across 21 B2B SaaS brands we tracked in both Q1 and Q3 2026, LLM referral traffic grew 2.4x, while LLM traffic to the blog fell 8%.
Most of the extra visitors went to homepages, login screens and help centers, where sessions grew 20x. Two brands still grew their blog traffic 2x and 3x, and what they shared predicted blog traffic across all 21 brands at a correlation of 0.95.
We pulled 246,948 LLM sessions from GA4 for Q3 2026, across 34 B2B SaaS brands and 16,521 landing pages, and tagged every URL by page type. Every Q1 comparison uses the 21 brands also behind our Q1 page-type study.
- The homepage took 36% of LLM sessions in Q3. Homepage sessions grew 2.8x.
- Help and docs sessions grew 20x, from 447 to 9,222. Single support articles earned 265 to 456 sessions on pre-sales questions.
- Blog traffic followed the cited-post count. The number of posts earning LLM sessions tracked blog sessions at a correlation of 0.95 across 21 brands.
- Pricing pages earned the most per page, at a median of 9 LLM sessions. Comparison posts averaged about 2x a standard post.
- Free tools split by type. Live-data checkers grew 85% while converters and templates fell 35% to 100%.
- Gemini sent 17% of its sessions to the blog, against 6% for ChatGPT, whose blog sessions rose 2% while its total tripled.
How We Ran the Study
This is a traffic study. The data is GA4 landing-page sessions where the source was an LLM: ChatGPT, Claude, Gemini, Perplexity or Copilot. It's what we saw across our own client portfolio. Other teams may have seen different things.
Every figure in this study is a count of LLM sessions. The brands are B2B SaaS companies across payments, martech, HR tech, logistics, sales tech and dev tools, plus a few others, all anonymized.
We tracked 21 brands in both Q1 and Q3, and every comparison in this report uses those brands.
- One set of page-type rules. We tagged every URL by path, such as /blog/, /pricing, /docs/, /help/ and language folders. The same rules were applied back to Q1 and agreed with our manual Q1 tags 96% of the time.
- Cleaning. We removed one brand's Q3 Claude sessions because they showed an automated pattern: thousands of deep pages and almost no homepage visits.
- Homepage. GA4's "(not set)" landing pages are grouped with the homepage, the same convention as Q1.
We call the number of blog posts that earned at least one LLM session in a period a brand's cited-post count. As Chapter 3 shows, it predicted blog traffic better than anything else we looked at.
1. Homepages Now Get 36% of LLM Visits
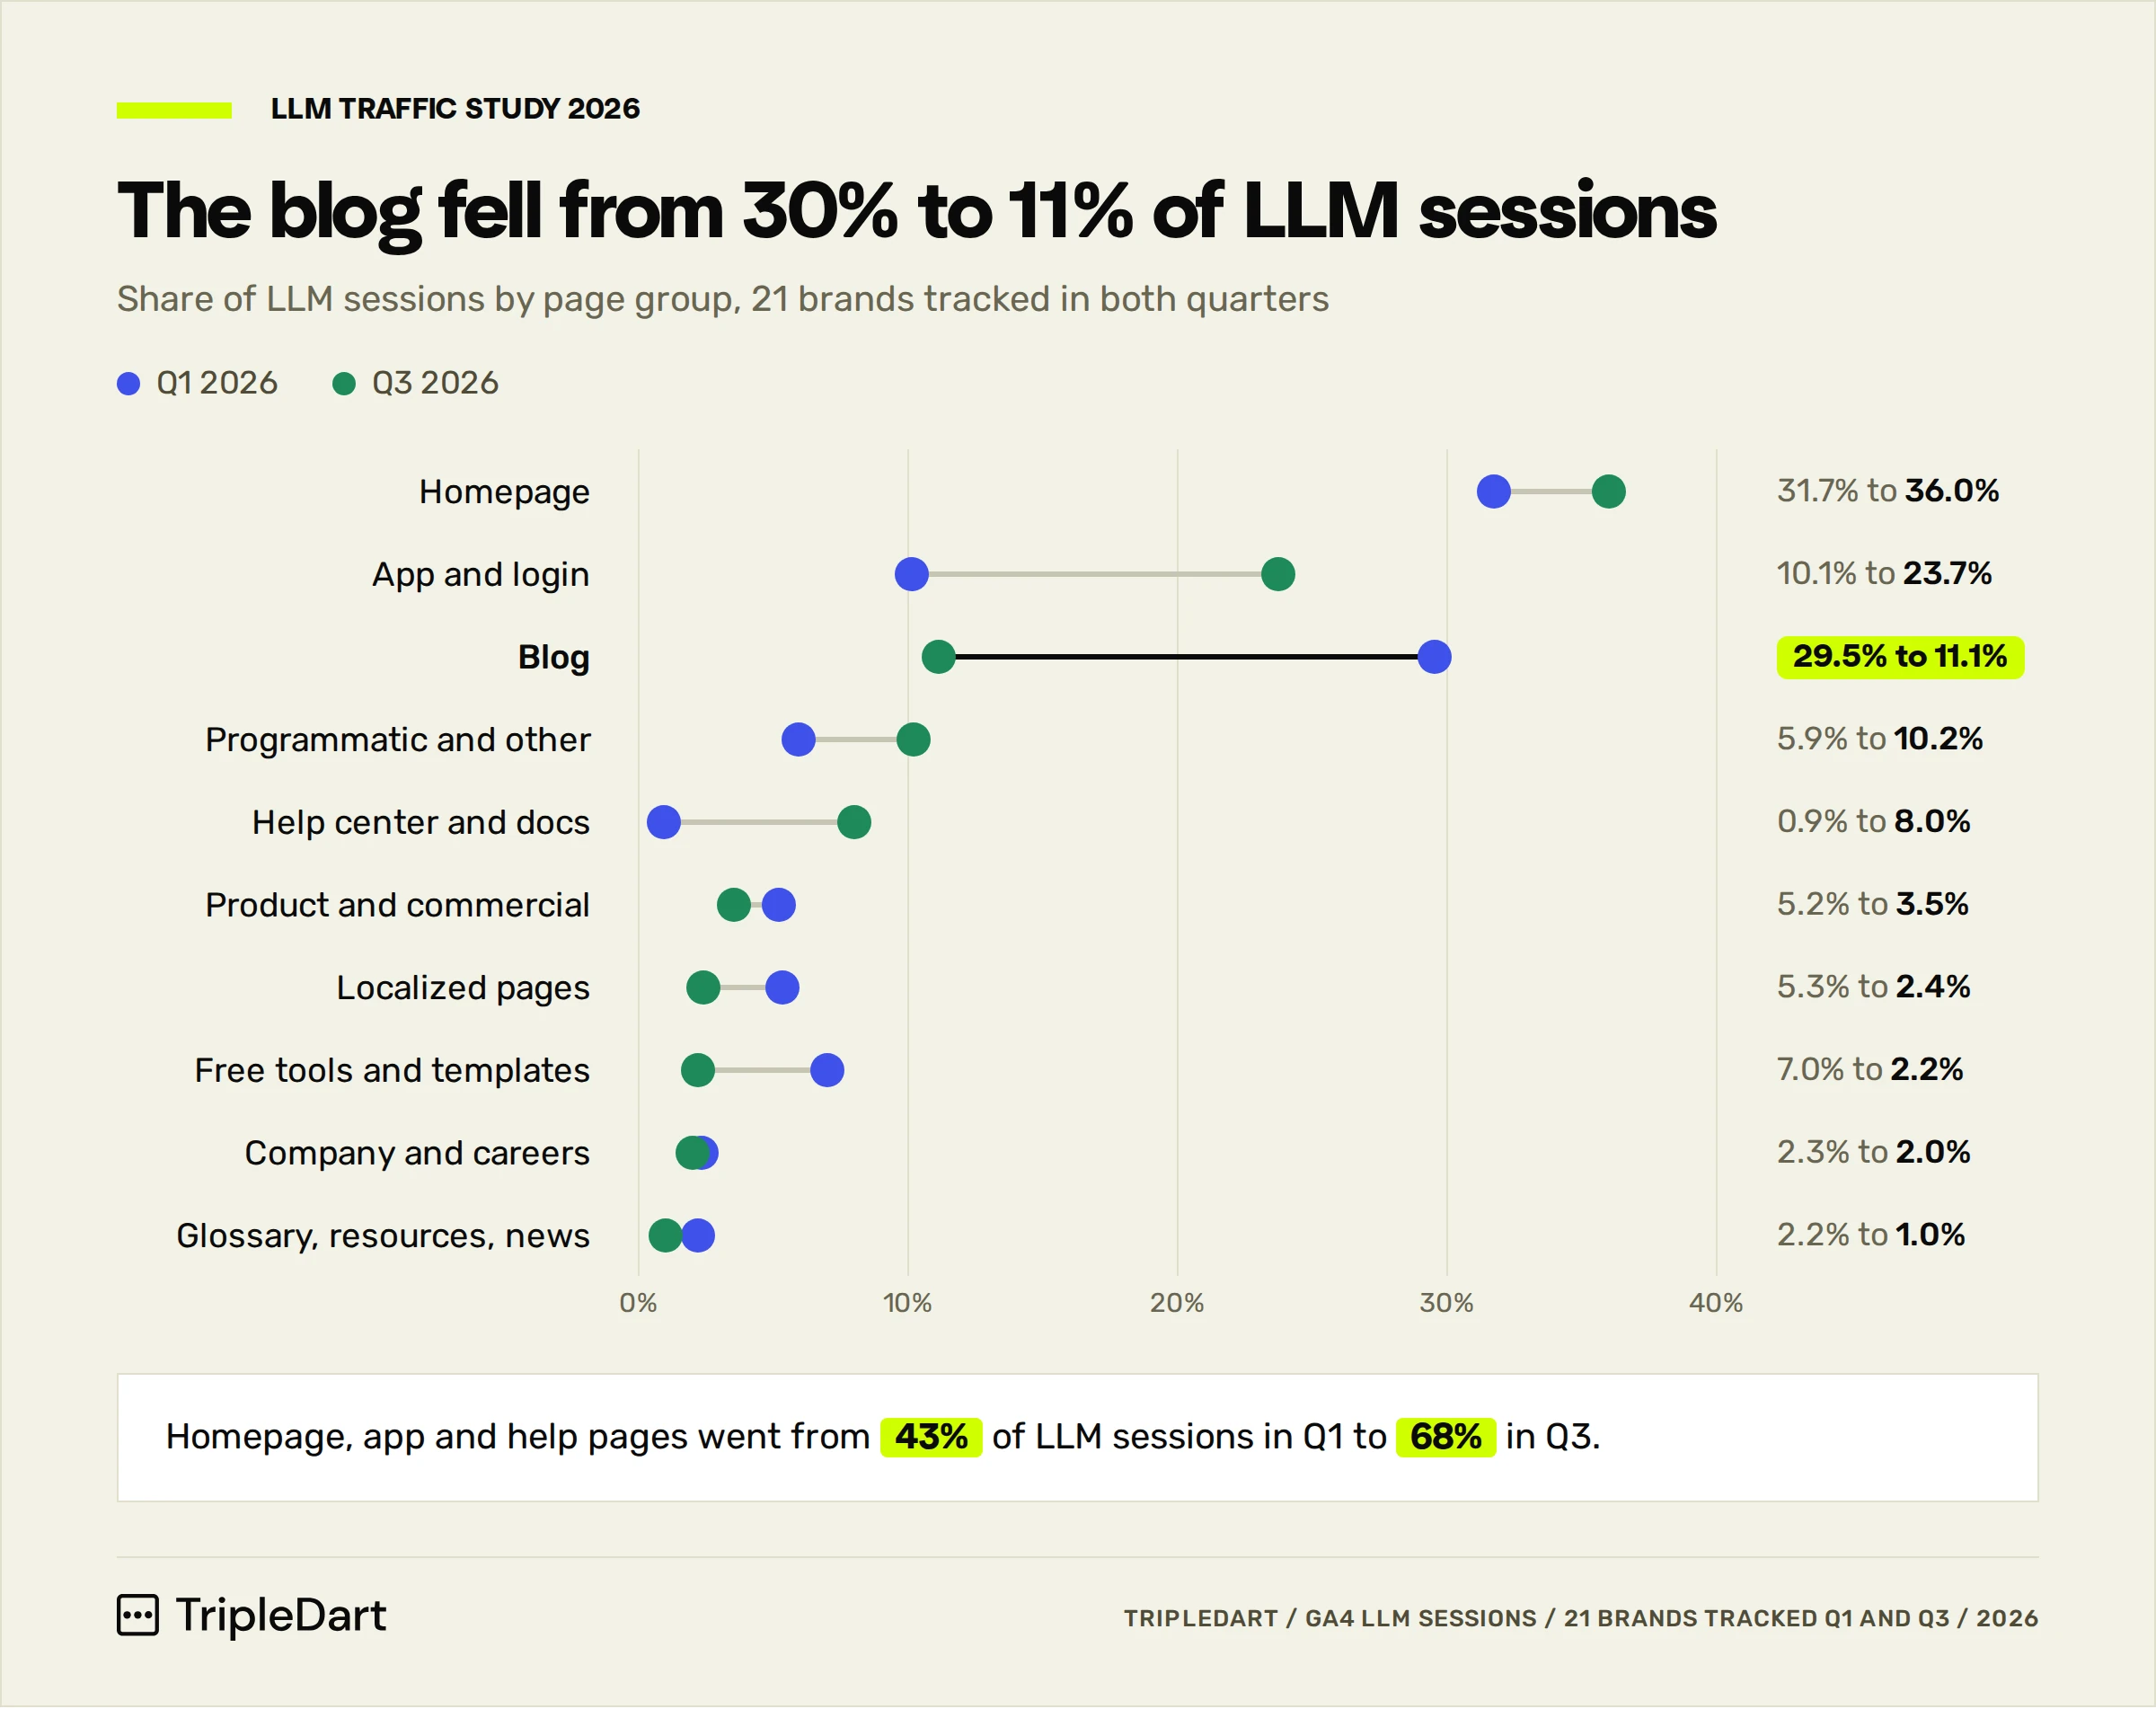
For the 21 brands, the homepage went from 31.7% of LLM sessions in Q1 to 36.0% in Q3. Homepage sessions grew from 14,948 to 41,616, and 11 of the 21 brands saw growth.
When ChatGPT recommends a tool, visitors usually click through to the brand's homepage to learn more and see what the product looks like.
App and Login Pages Grew 5.8x
App and login sessions went from 4,754 to 27,338. These are existing users asking an assistant how to log in to a product, or where a setting lives, and clicking through.
It helps retention, so keep it out of pipeline reporting. The UGC creator marketplace shows why: its app and login pages went from 343 sessions to 13,310 while its blog traffic fell.
What We'd Change on the Homepage First
Someone arriving from ChatGPT already has a summary of you in mind. Make the first screen confirm it:
- What the product does, in one plain sentence.
- Who it's for.
- A price signal, even a starting price or a link to pricing.
- Proof, such as named customers or a review score.
Then track LLM-sourced homepage sessions as their own segment, so that growth doesn't disappear into total traffic.
2. Help Centers Grew 20x by Answering Buyers' Questions
Help and docs sessions went from 447 to 9,222 for the like-for-like brands, from 0.9% of LLM sessions to 8.0%. The time-tracking tool's knowledge base went from 30 sessions to 7,971, and the payments platform's developer overview page earned 4,742.
Which Help Articles Got the Traffic?
Some of the payments platform's busiest help pages answer questions a buyer asks before signing up:
Each of these articles earned more LLM sessions than any blog post in the dataset except one, the top listicle at 815.
Help Articles Earn the Second-Most Sessions per Page
Across all 34 brands, the median help article earned 7 LLM sessions in Q3. Only pricing pages earned more, so help articles beat every blog format we tagged.
What We'd Change in the Help Center First
- Pull the support articles that already get LLM traffic.
- Answer the question in the first two lines, the way an assistant would quote it.
- Link each one to pricing or a demo.
- Fill the gaps buyers ask about before they sign up, such as supported countries, limits, compliance and migrations.
Apply the rules we use for structuring content for AEO and GEO to your support articles too. They rarely get that attention.
3. Blogs Grew Only Where More Posts Got Cited
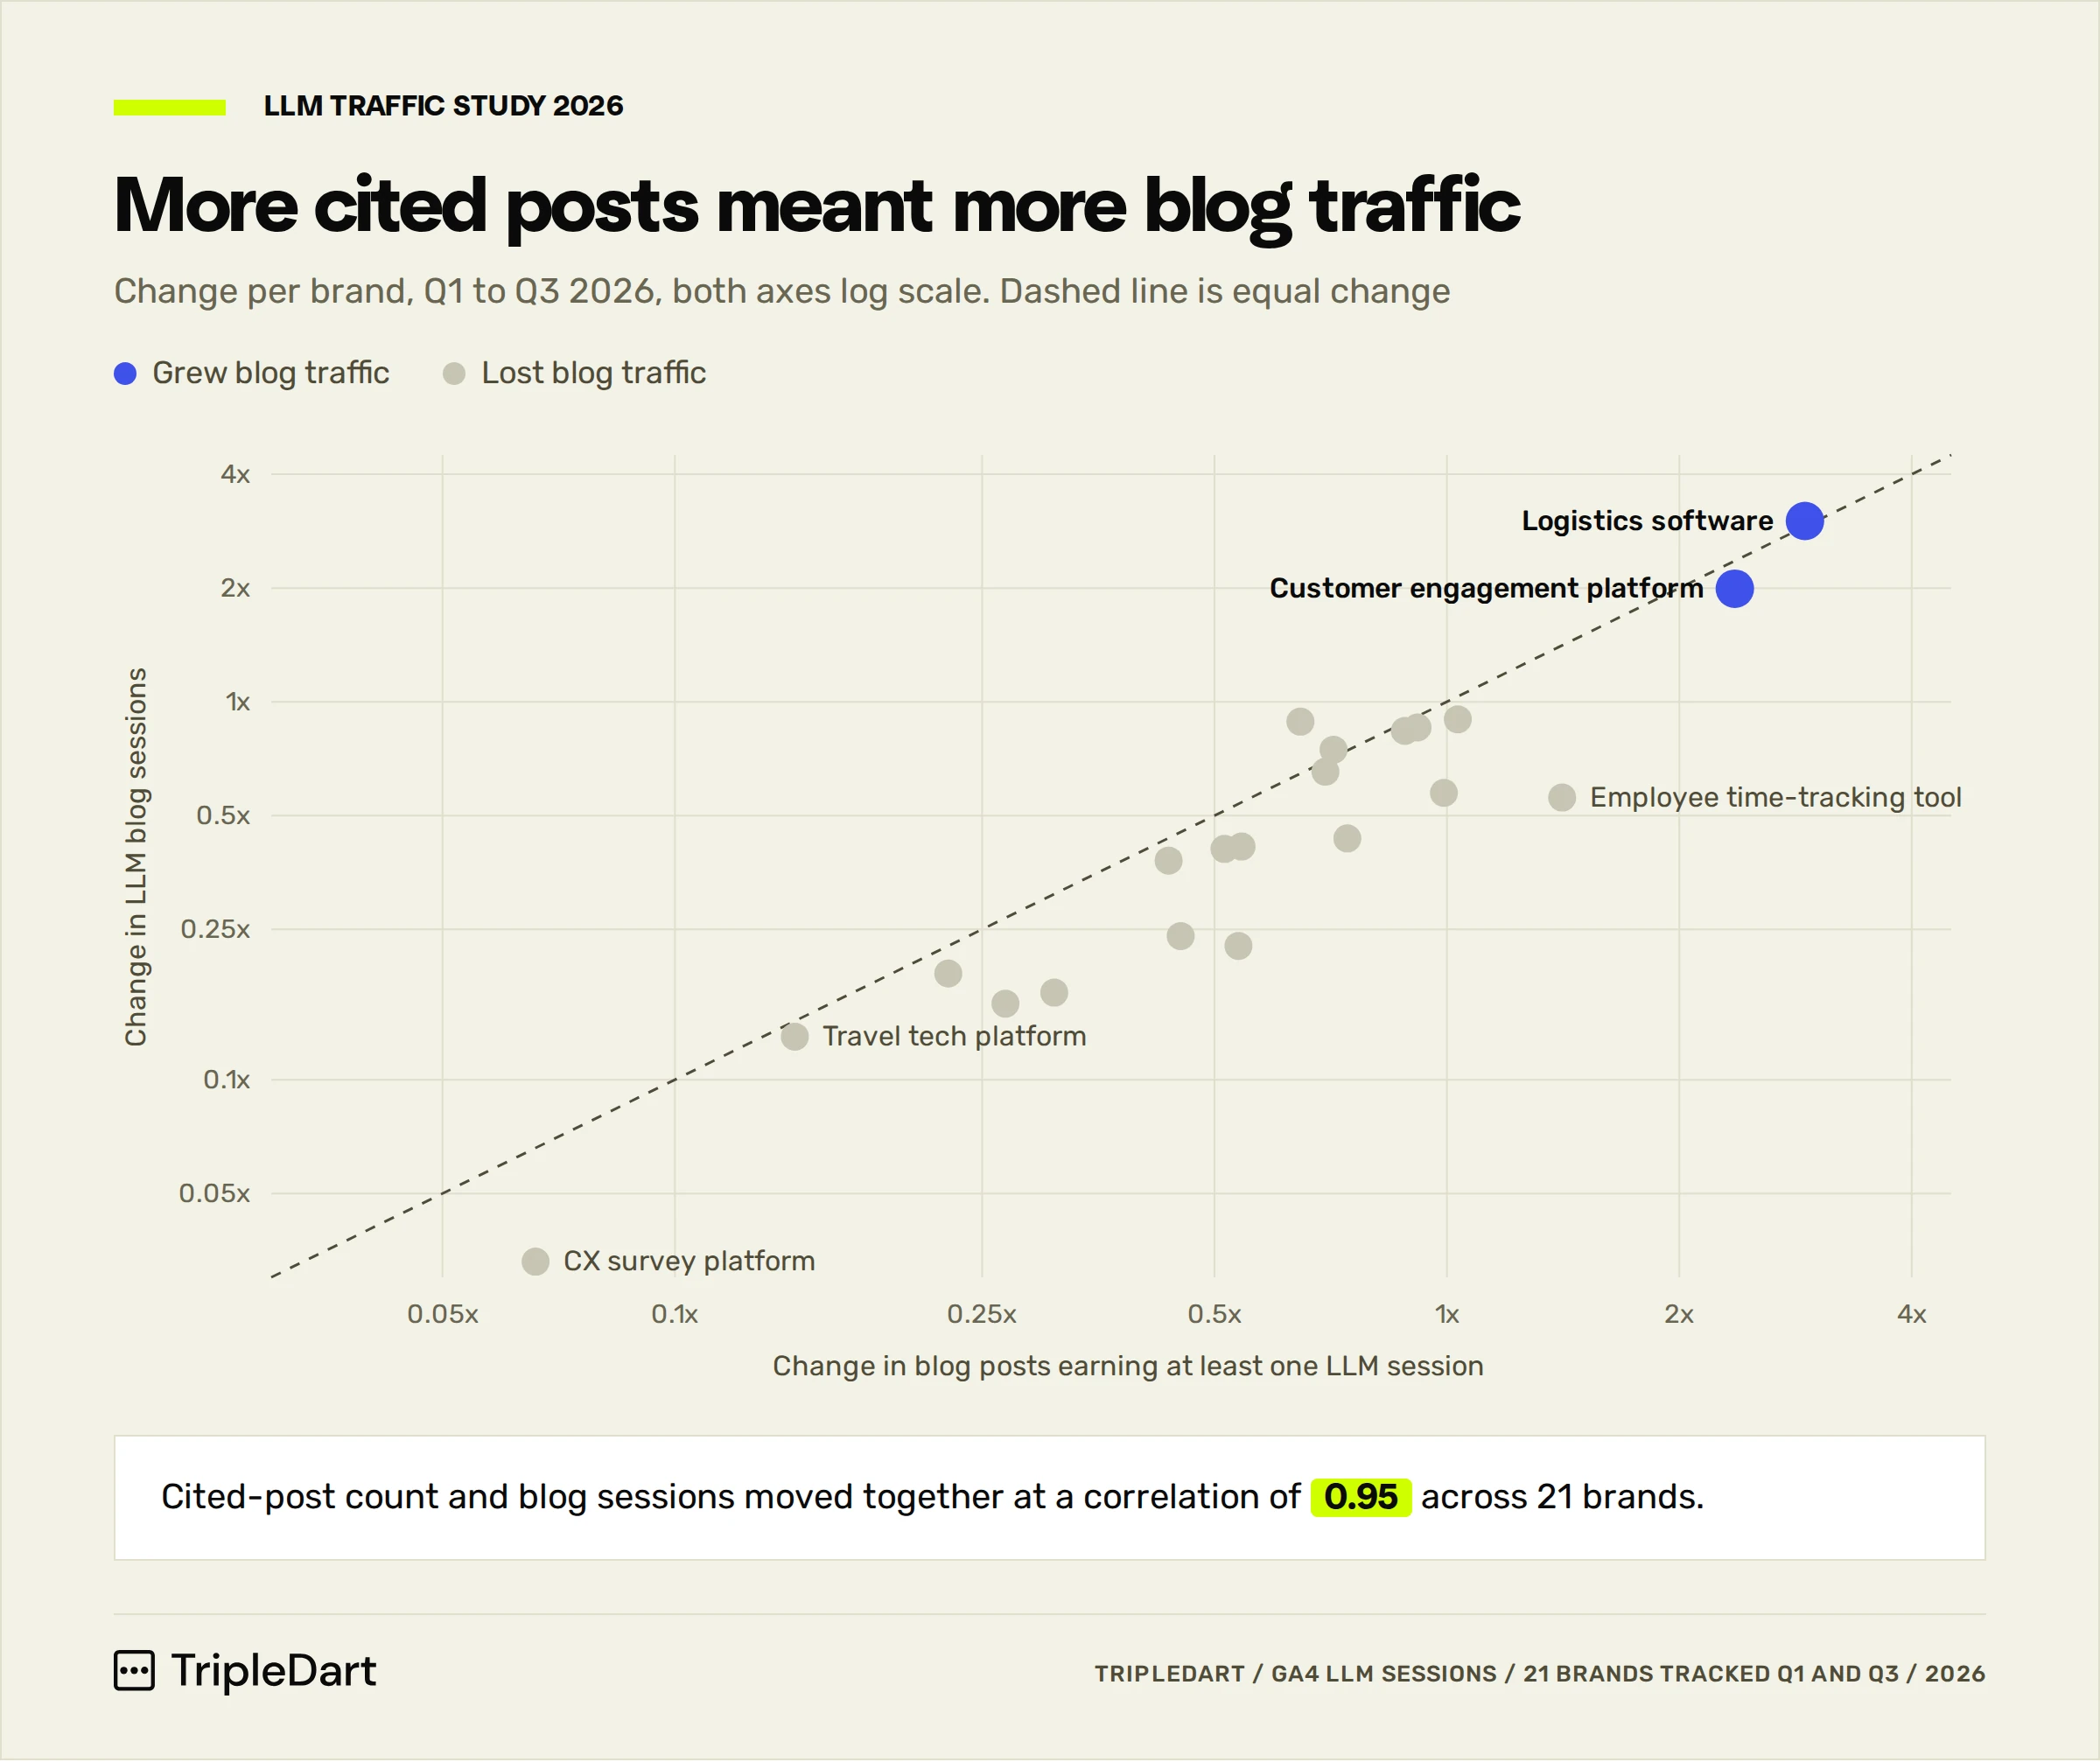
LLM blog sessions for the 21 brands went from 13,942 to 12,812. Two brands grew their blog traffic 2x and 3x, and the other 19 fell 45%, from 10,552 to 5,757.
The cited-post count separated them. Across all 21 brands, cited-post count and blog sessions moved together with a correlation of 0.95. A perfect match would be 1.0.
What the Two Growing Brands Did
The logistics software brand grew its cited-post count 2.9x and its blog sessions 3x. The customer engagement platform grew cited posts 2.4x and blog sessions 2x.
Both grew by adding posts to the pool. No single post carried the growth: the best one earned 0.8% of the customer engagement platform's blog sessions and 2.7% of the logistics brand's. Each post earns very few clicks.
Why One Strong Post Can't Carry It
In Q3, 64% of blog posts that got any LLM traffic got one or two sessions all quarter. The top 10 blog posts across all 34 brands made up only 10% of blog sessions.
So LLM blog traffic is a long tail: it grows when more posts earn a few clicks each.
Refresh Before You Write: 60% of Q1's Cited Posts Dropped Out
Of the 3,604 blog posts that earned LLM sessions in Q1, only 1,440 still did in Q3. Another 2,435 posts earned LLM sessions in Q3 that hadn't in Q1.
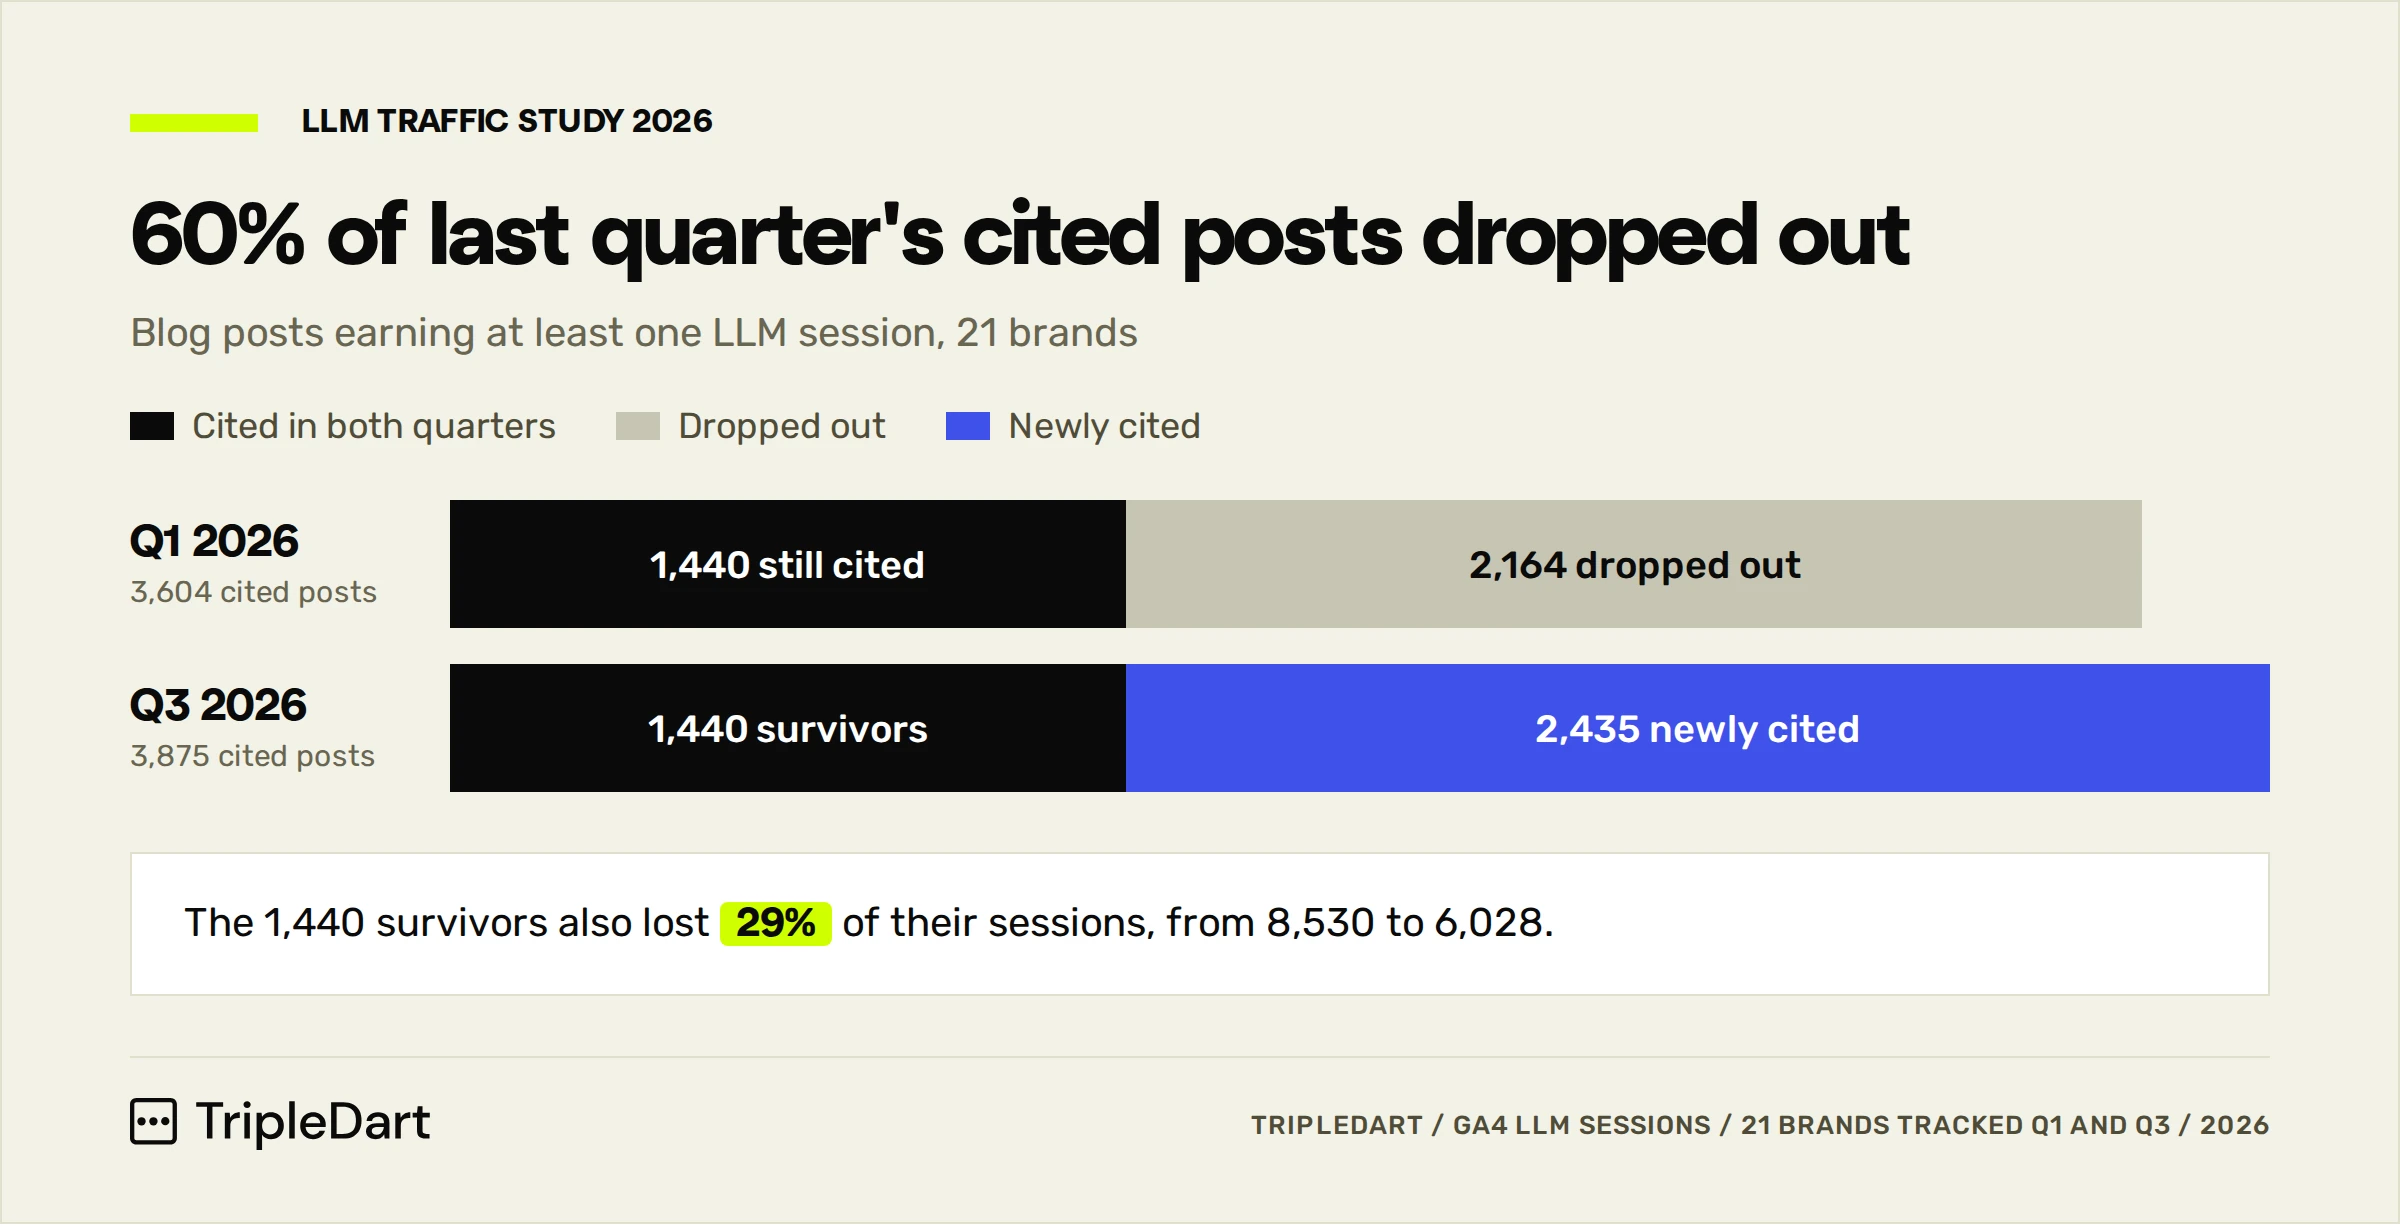
The 1,440 survivors lost 29% of their sessions, from 8,530 to 6,028. A refresh program on posts cited in the last six months costs less than new content and keeps the pool from shrinking.
LLM visibility for blog content behaved a lot like early SEO in our data. It decayed unless the team kept publishing and refreshing.
Report the Count Every Month
Count how many blog posts earned at least one LLM session each month. If the number falls, publishing and refreshing have fallen behind, and it belongs next to sessions among the GEO metrics we track.
4. A Pricing Page Earns 4x a Blog Post
Totals favor whatever a site has the most of. So we also looked at what one page of each type earned from LLMs in Q3, across all 34 brands.
Product and commercial pages (product, pricing, demo, integrations and case studies) grew from 2,434 LLM sessions to 4,027 for the like-for-like brands, about 1.7x. Their share still fell from 5.2% to 3.5% because homepage, app and help traffic grew faster.
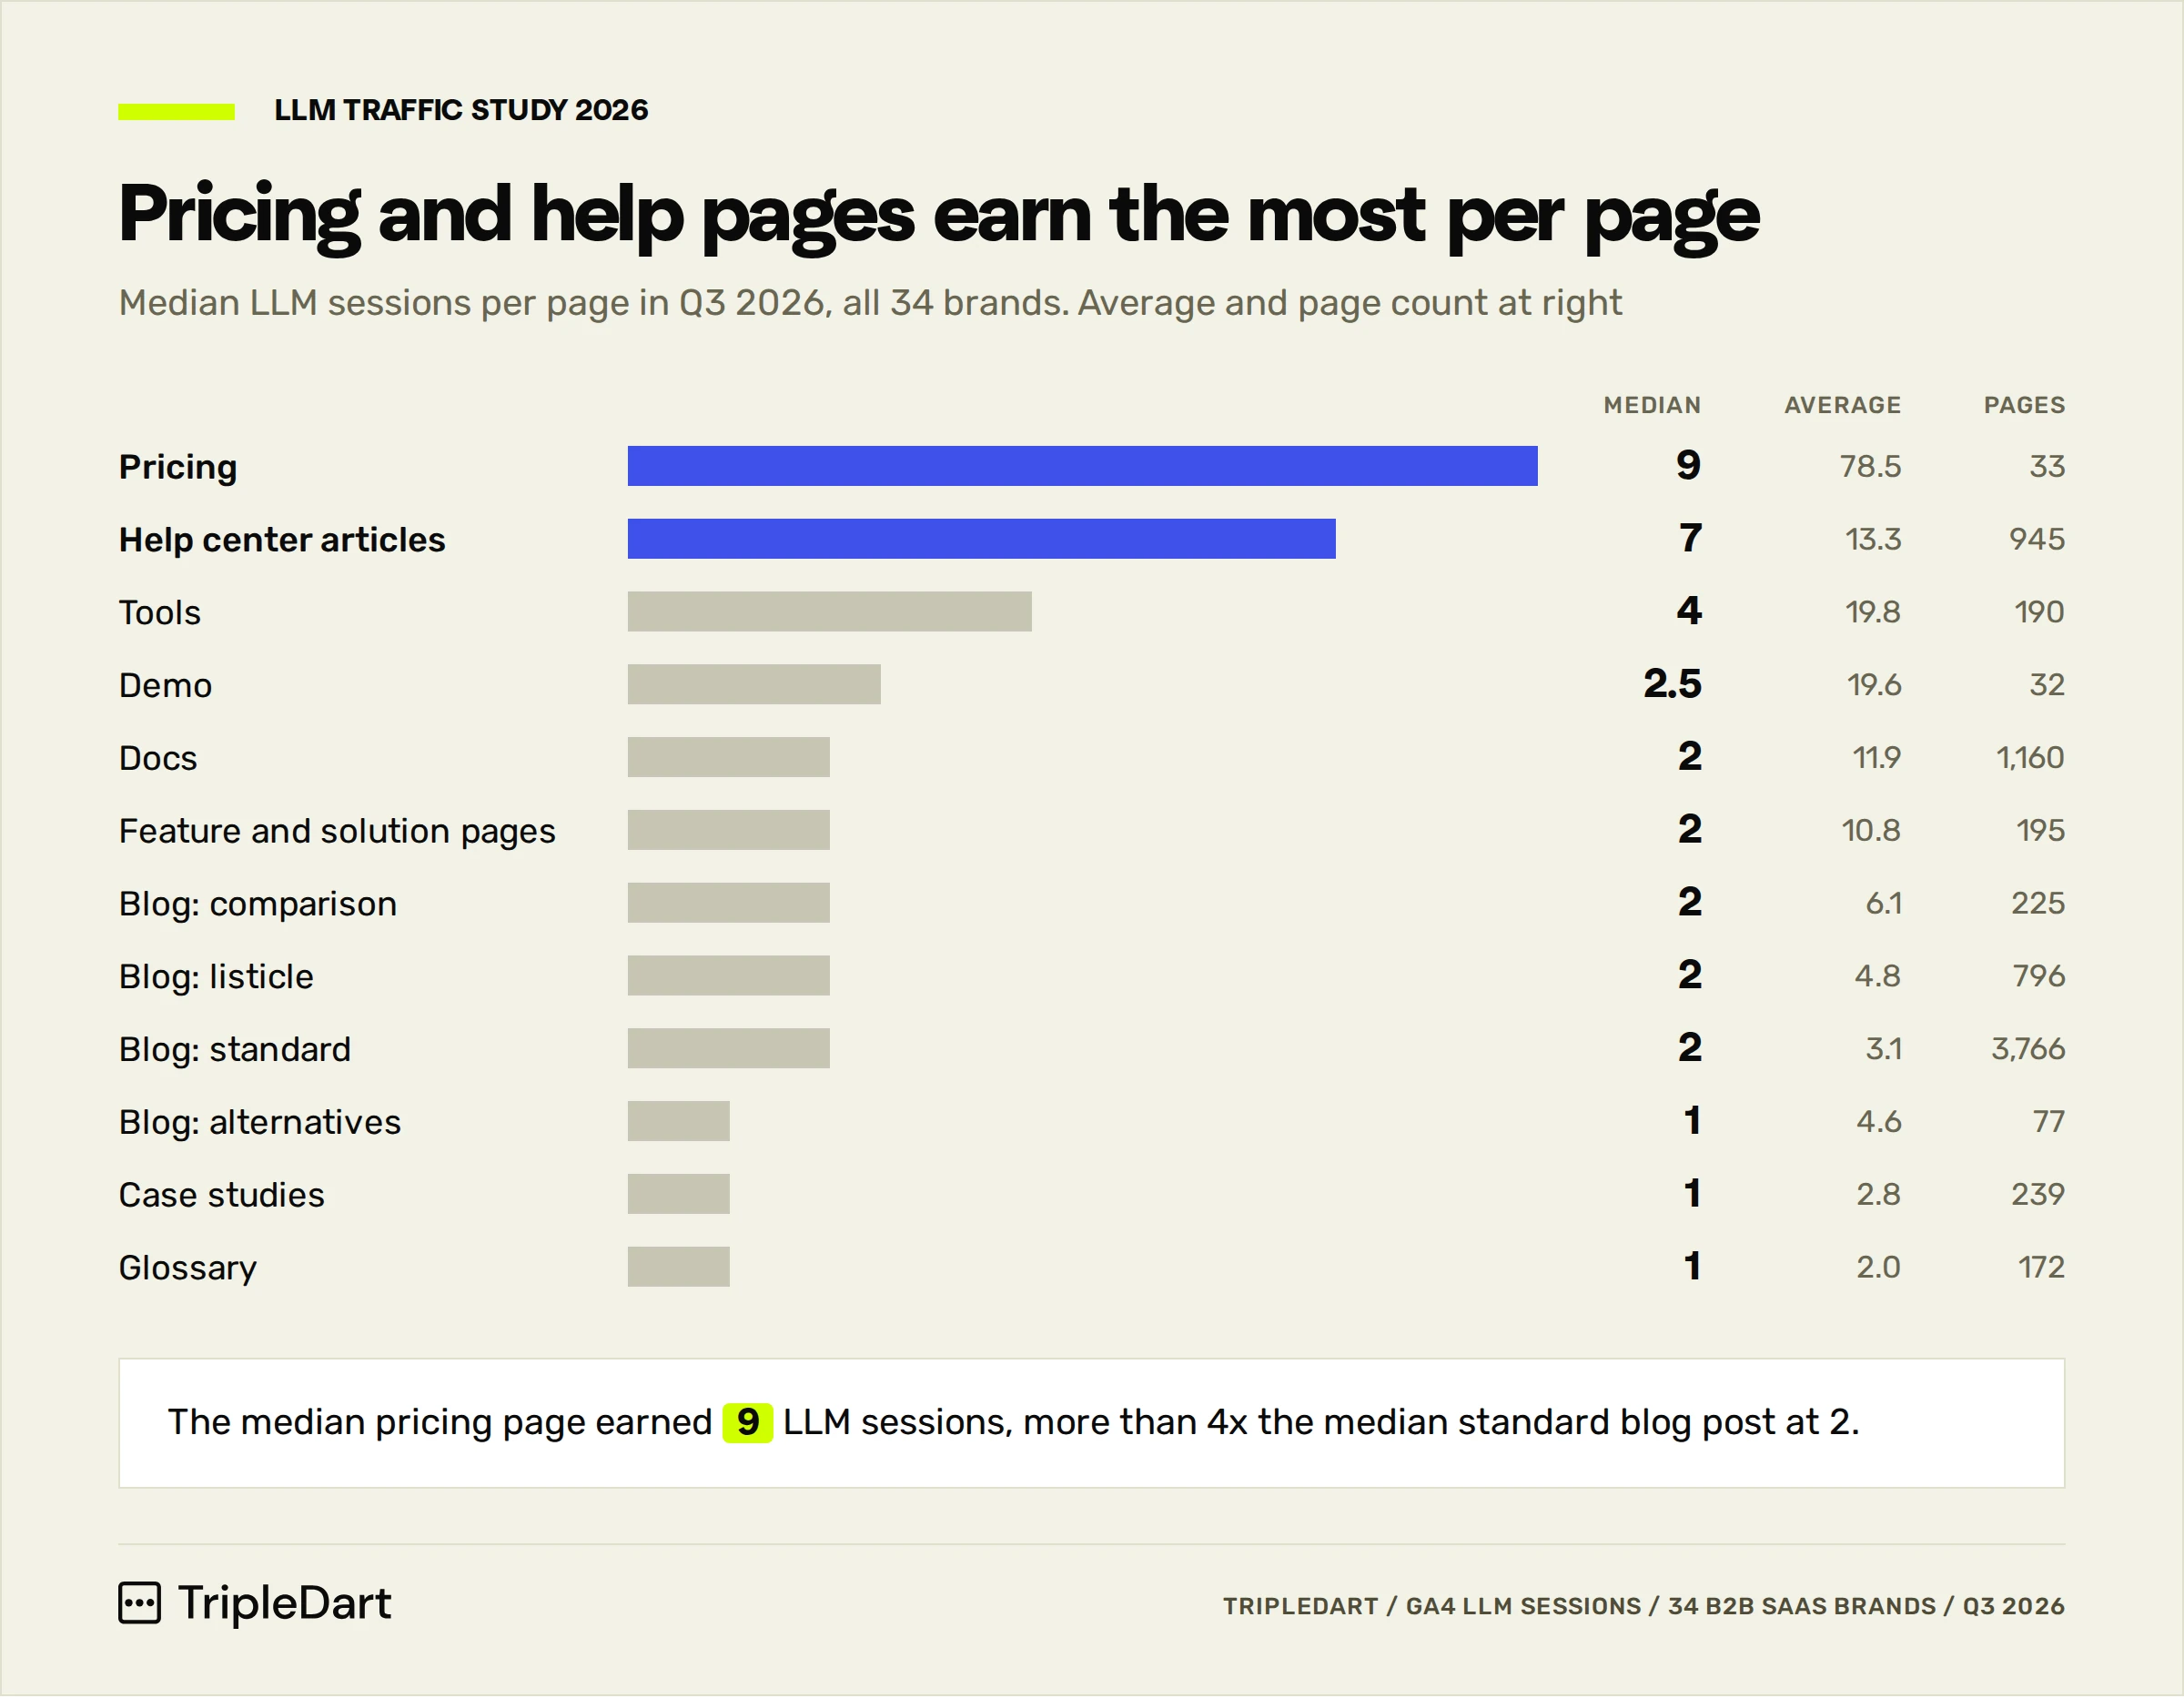
Pricing Pages: a Median of 9 Sessions, More Than 4x a Blog Post
One pricing page, the payments platform's, pulled 891 sessions and inflates the 78.5 average. The median of 9 is the fairer figure, and it's more than 4x the median standard blog post at 2.
Buyers ask an assistant what something costs and click through to check the number. Blog pricing posts also doubled, from 41 to 85 sessions in Q3.
Your Own Comparison and Alternatives Pages
On average, a comparison post earned 6.1 sessions against 3.1 for a standard post, about 2x. Several of the best blog-type pages in the dataset compared the brand to a rival:
- An AI presentation tool's head-to-head against its biggest rival earned 145 sessions.
- The payments platform's comparison against a merchant-of-record competitor earned 132.
- The same platform's page on alternatives to a major payments brand earned 75.
Our guide to competitor comparison landing pages covers how we structure these.
Self-Inclusive Listicles and Statistics Roundups
The top blog post in the dataset was a "best UGC software" listicle on the UGC marketplace's own site, with 815 sessions. That's roughly 6x the next-best post, and it names the publisher's own product in a category buyers ask ChatGPT about.
A sales compensation platform's "sales productivity statistics" and "sales compensation statistics" posts both made its top 10 pages. Assistants usually cite a number with a source, as we found in our study of what AI Overview cites.
5. Free Tools Survive When ChatGPT Can't Do the Job
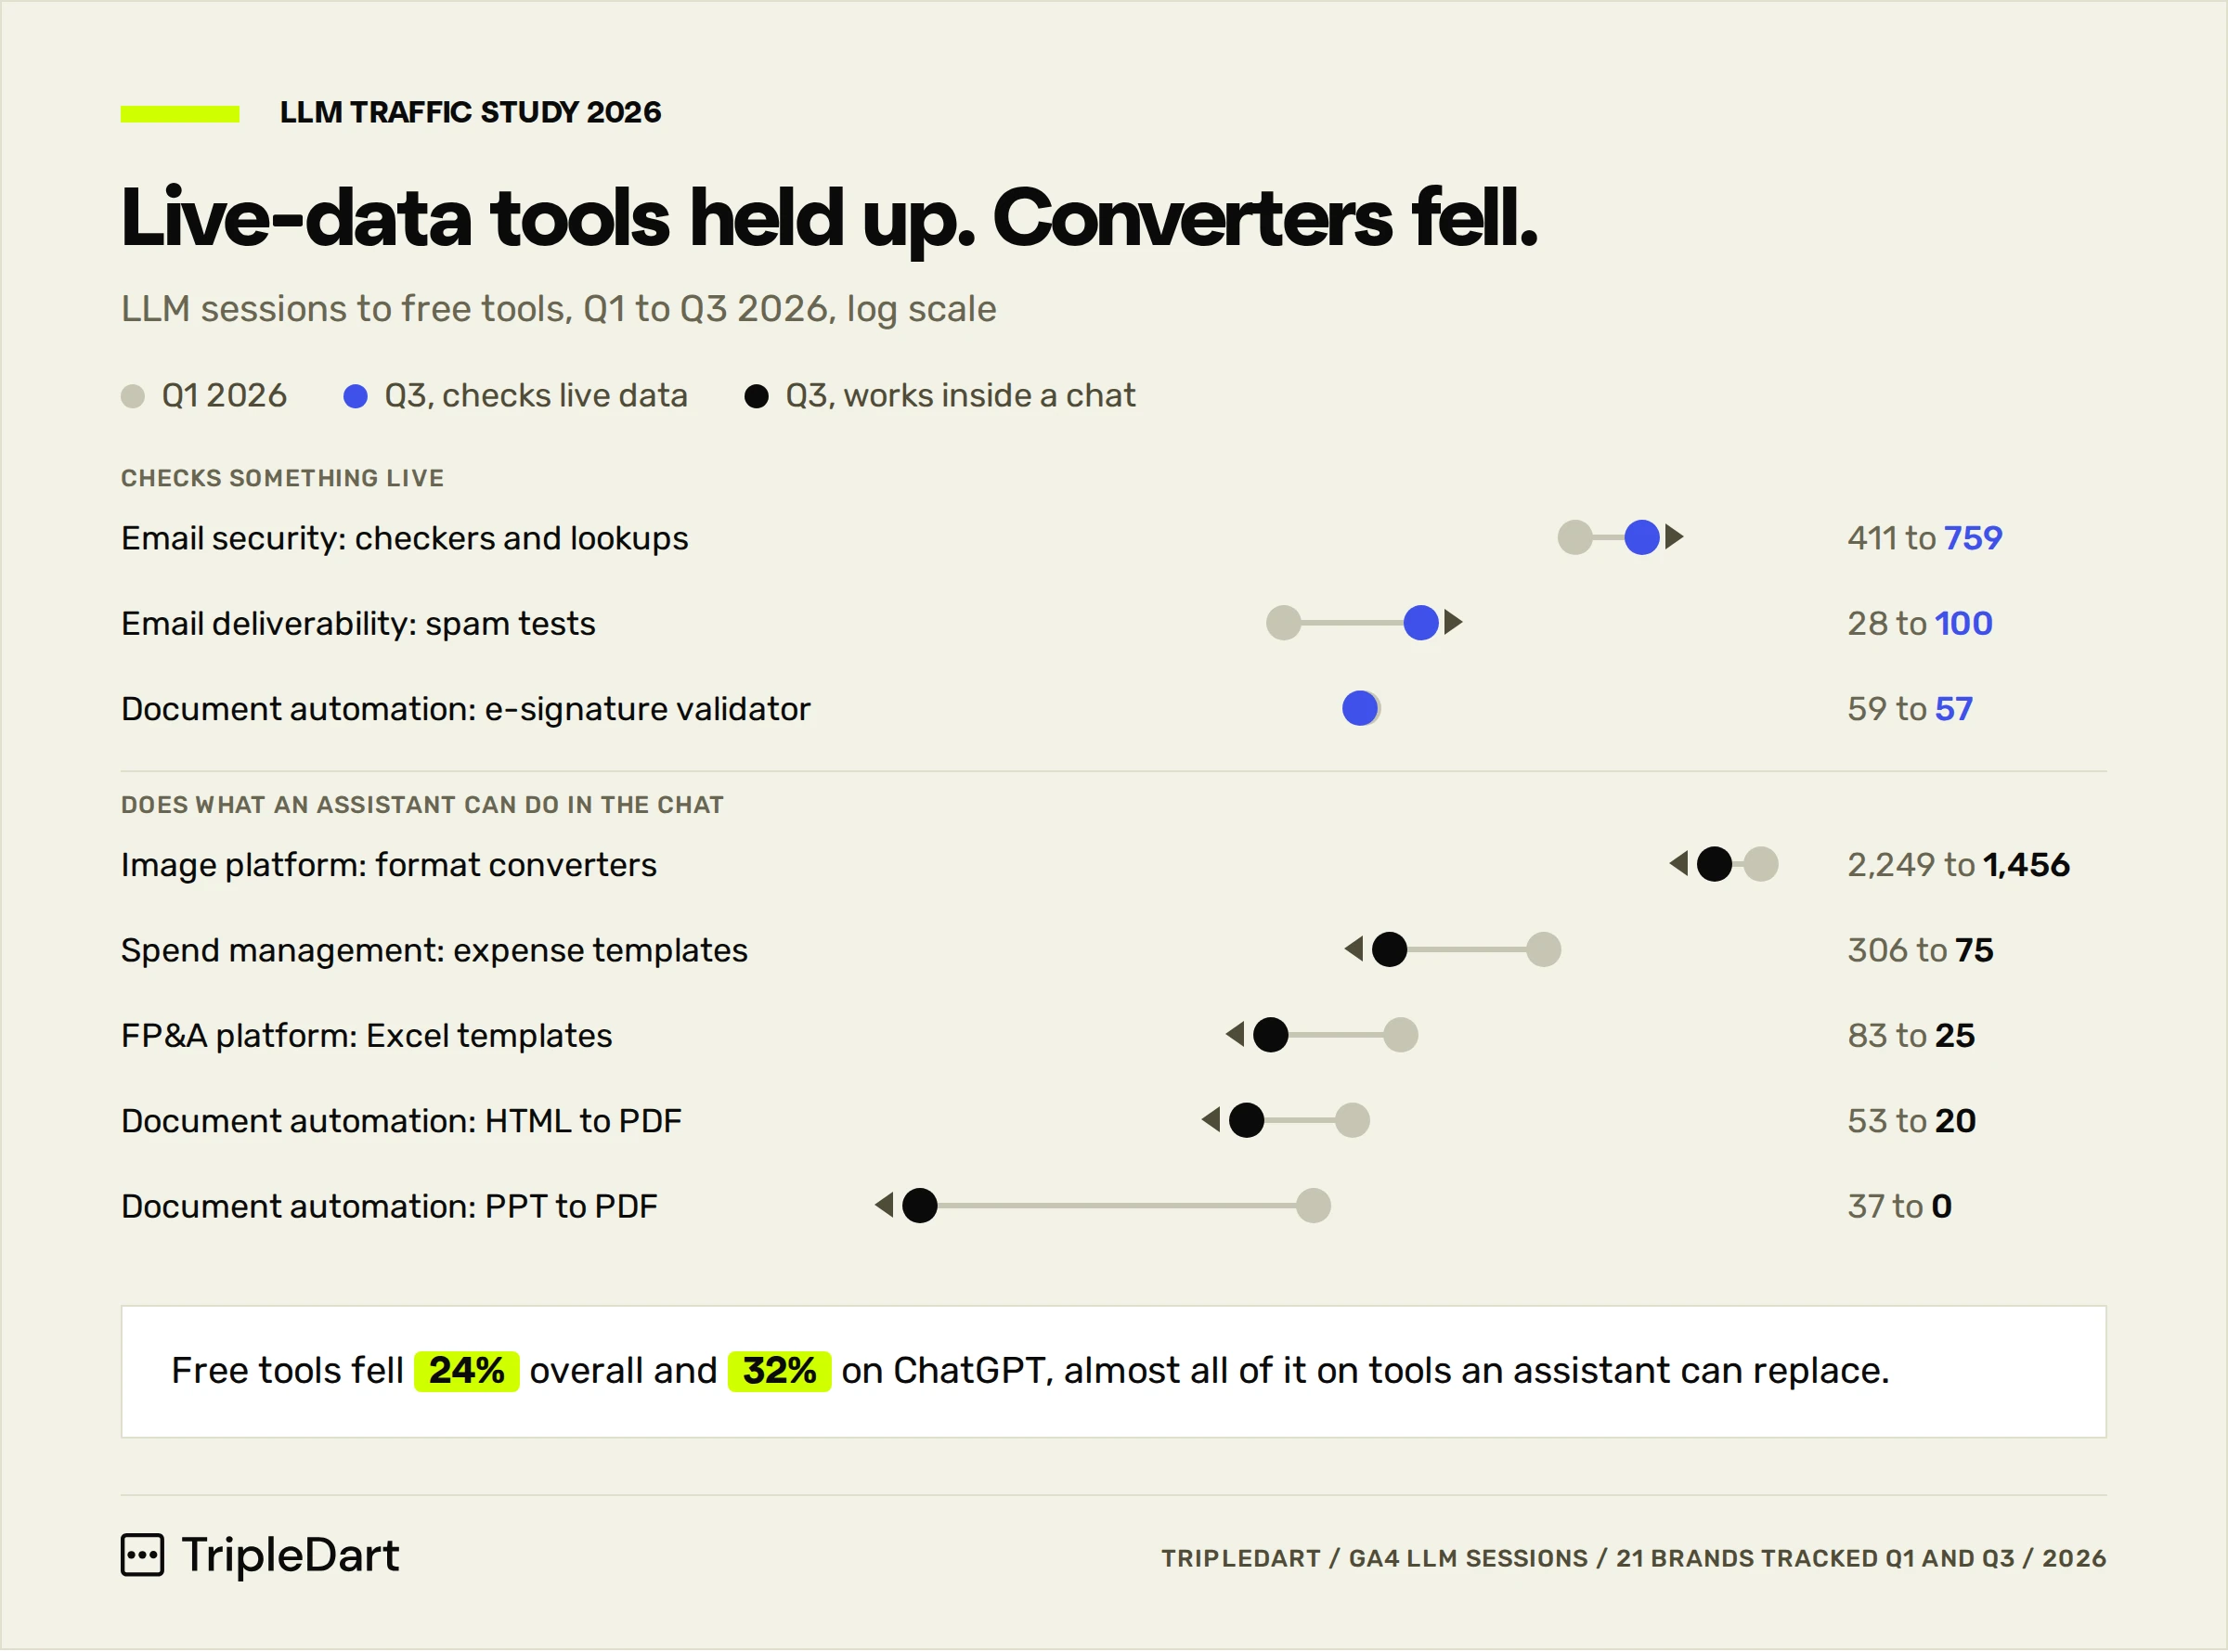
Free tools and templates fell 24% overall for the like-for-like brands, from 3,311 LLM sessions to 2,519. On ChatGPT, the drop was 32%. Almost all of the decline hit tools an assistant can replace.
The Tools That Grew
- The email security platform's checkers and lookups went from 411 sessions to 759, up 85%.
- The email deliverability tool's spam and deliverability tests went from 28 to 100.
- The document automation tool's e-signature validator held roughly flat, from 59 to 57.
Each one runs against something outside the chat: the DNS records on a domain, a live inbox or a signed document. Checking your own DMARC record needs a tool that reads your domain, so an assistant asked about it links out to one.
One Question Before You Build a Free Tool
Could ChatGPT do this without leaving the chat? In our data, tools that run on live data from outside the chat held up or grew, while tools an assistant can replace fell 35% to 100%.
6. Gemini Sends 17% of Its Visitors to the Blog, Nearly 3x ChatGPT's 6%
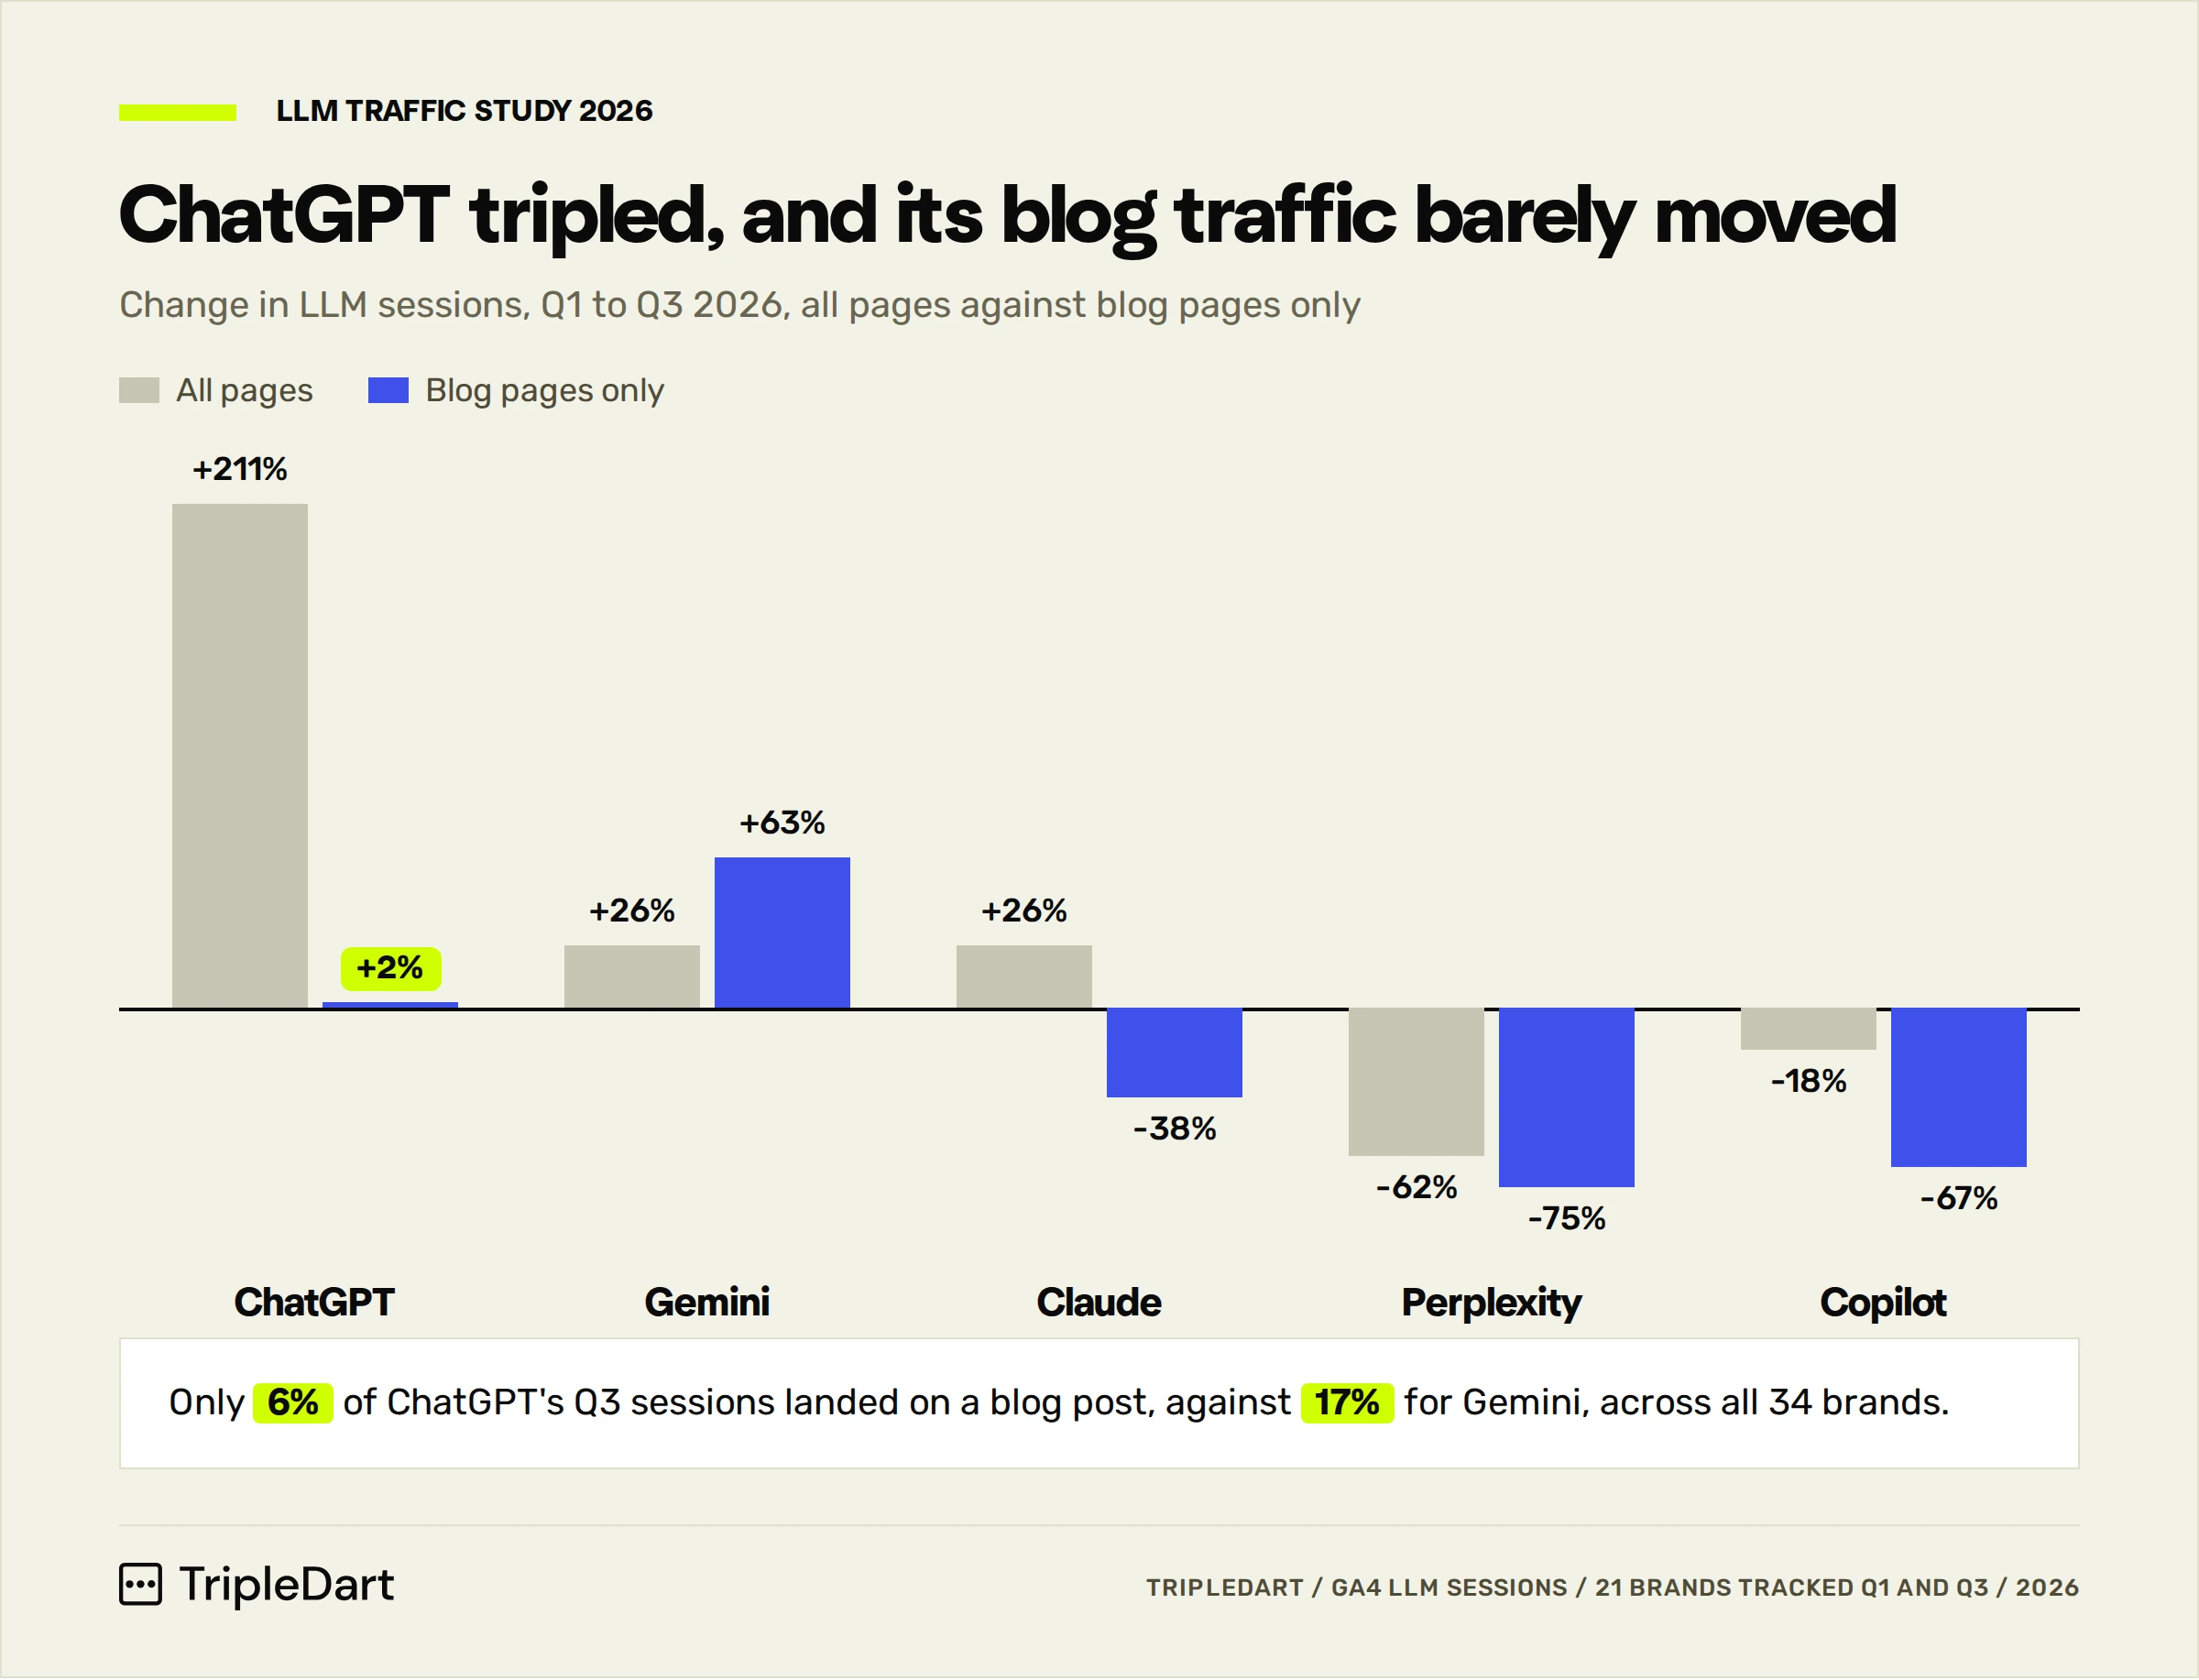
Across all 34 brands, 17% of Gemini's Q3 sessions landed on a blog post against 6% for ChatGPT. In the like-for-like set, Gemini's blog sessions grew 63% while the other platforms stalled or fell.
Why ChatGPT's Numbers Understate Content
ChatGPT sent 89% of LLM sessions in Q3, up from 70% in Q1, while its blog sessions rose only from 9,054 to 9,272. Its growth went to homepages (3.7x), app and login pages (6.9x) and help and docs (24x).
A content report built on ChatGPT totals will make the blog look worse than it's doing on Gemini. Judge content on Gemini's blog sessions as their own line.
Claude Grew 1.3x, With Blog Sessions Down 38%
Claude sessions grew from 2,307 to 2,903 for the like-for-like brands, after we removed one brand's automated Claude sessions. Its blog sessions fell 38%.
Add Engagement to Every LLM Report
Assistants that browse on a user's behalf load pages too, and GA4 counts each load as a session. Add engagement time and engaged-session rate to every LLM report so you can tell people from agents.
What Went Wrong in Q3
Everything above came with some evidence that it helped. Our data showed the opposite for each move, and each one has a number behind it.
Converters and Templates
Each of these does something an assistant can now do in the conversation: convert a format, fill a template, look up a per diem rate.
Comparison and Alternatives Posts, Counted in Total
Comparison posts fell 32% in total sessions and alternatives posts fell 73%, both from small bases. Per page, comparison posts still earn more than a standard post: 6.1 sessions on average against 3.1. Alternatives posts average 4.6, but the median one earns 1 session against 2 for a standard post, so judge them page by page. Standard posts fell 5% and listicles 8%.
Perplexity's 62% Drop
A drop that uniform usually points to a change in how visits are passed or tagged. Nineteen brands losing favor in the same quarter would be unusual. GA4 relies on whatever referral data each app or browser passes along, and AI browsers handle that differently.
We'd wait for Q4 data before acting on it. If Perplexity sessions stay low across the same 21 brands from October to December, the drop is likely genuine. If they recover, it was a tracking change.
Before You Benchmark Against This: The Median Brand Was Flat
The 21 like-for-like brands went from 47,198 LLM sessions in Q1 to 115,464 in Q3. The median brand changed by 0.99x, with 10 brands growing and 11 shrinking.
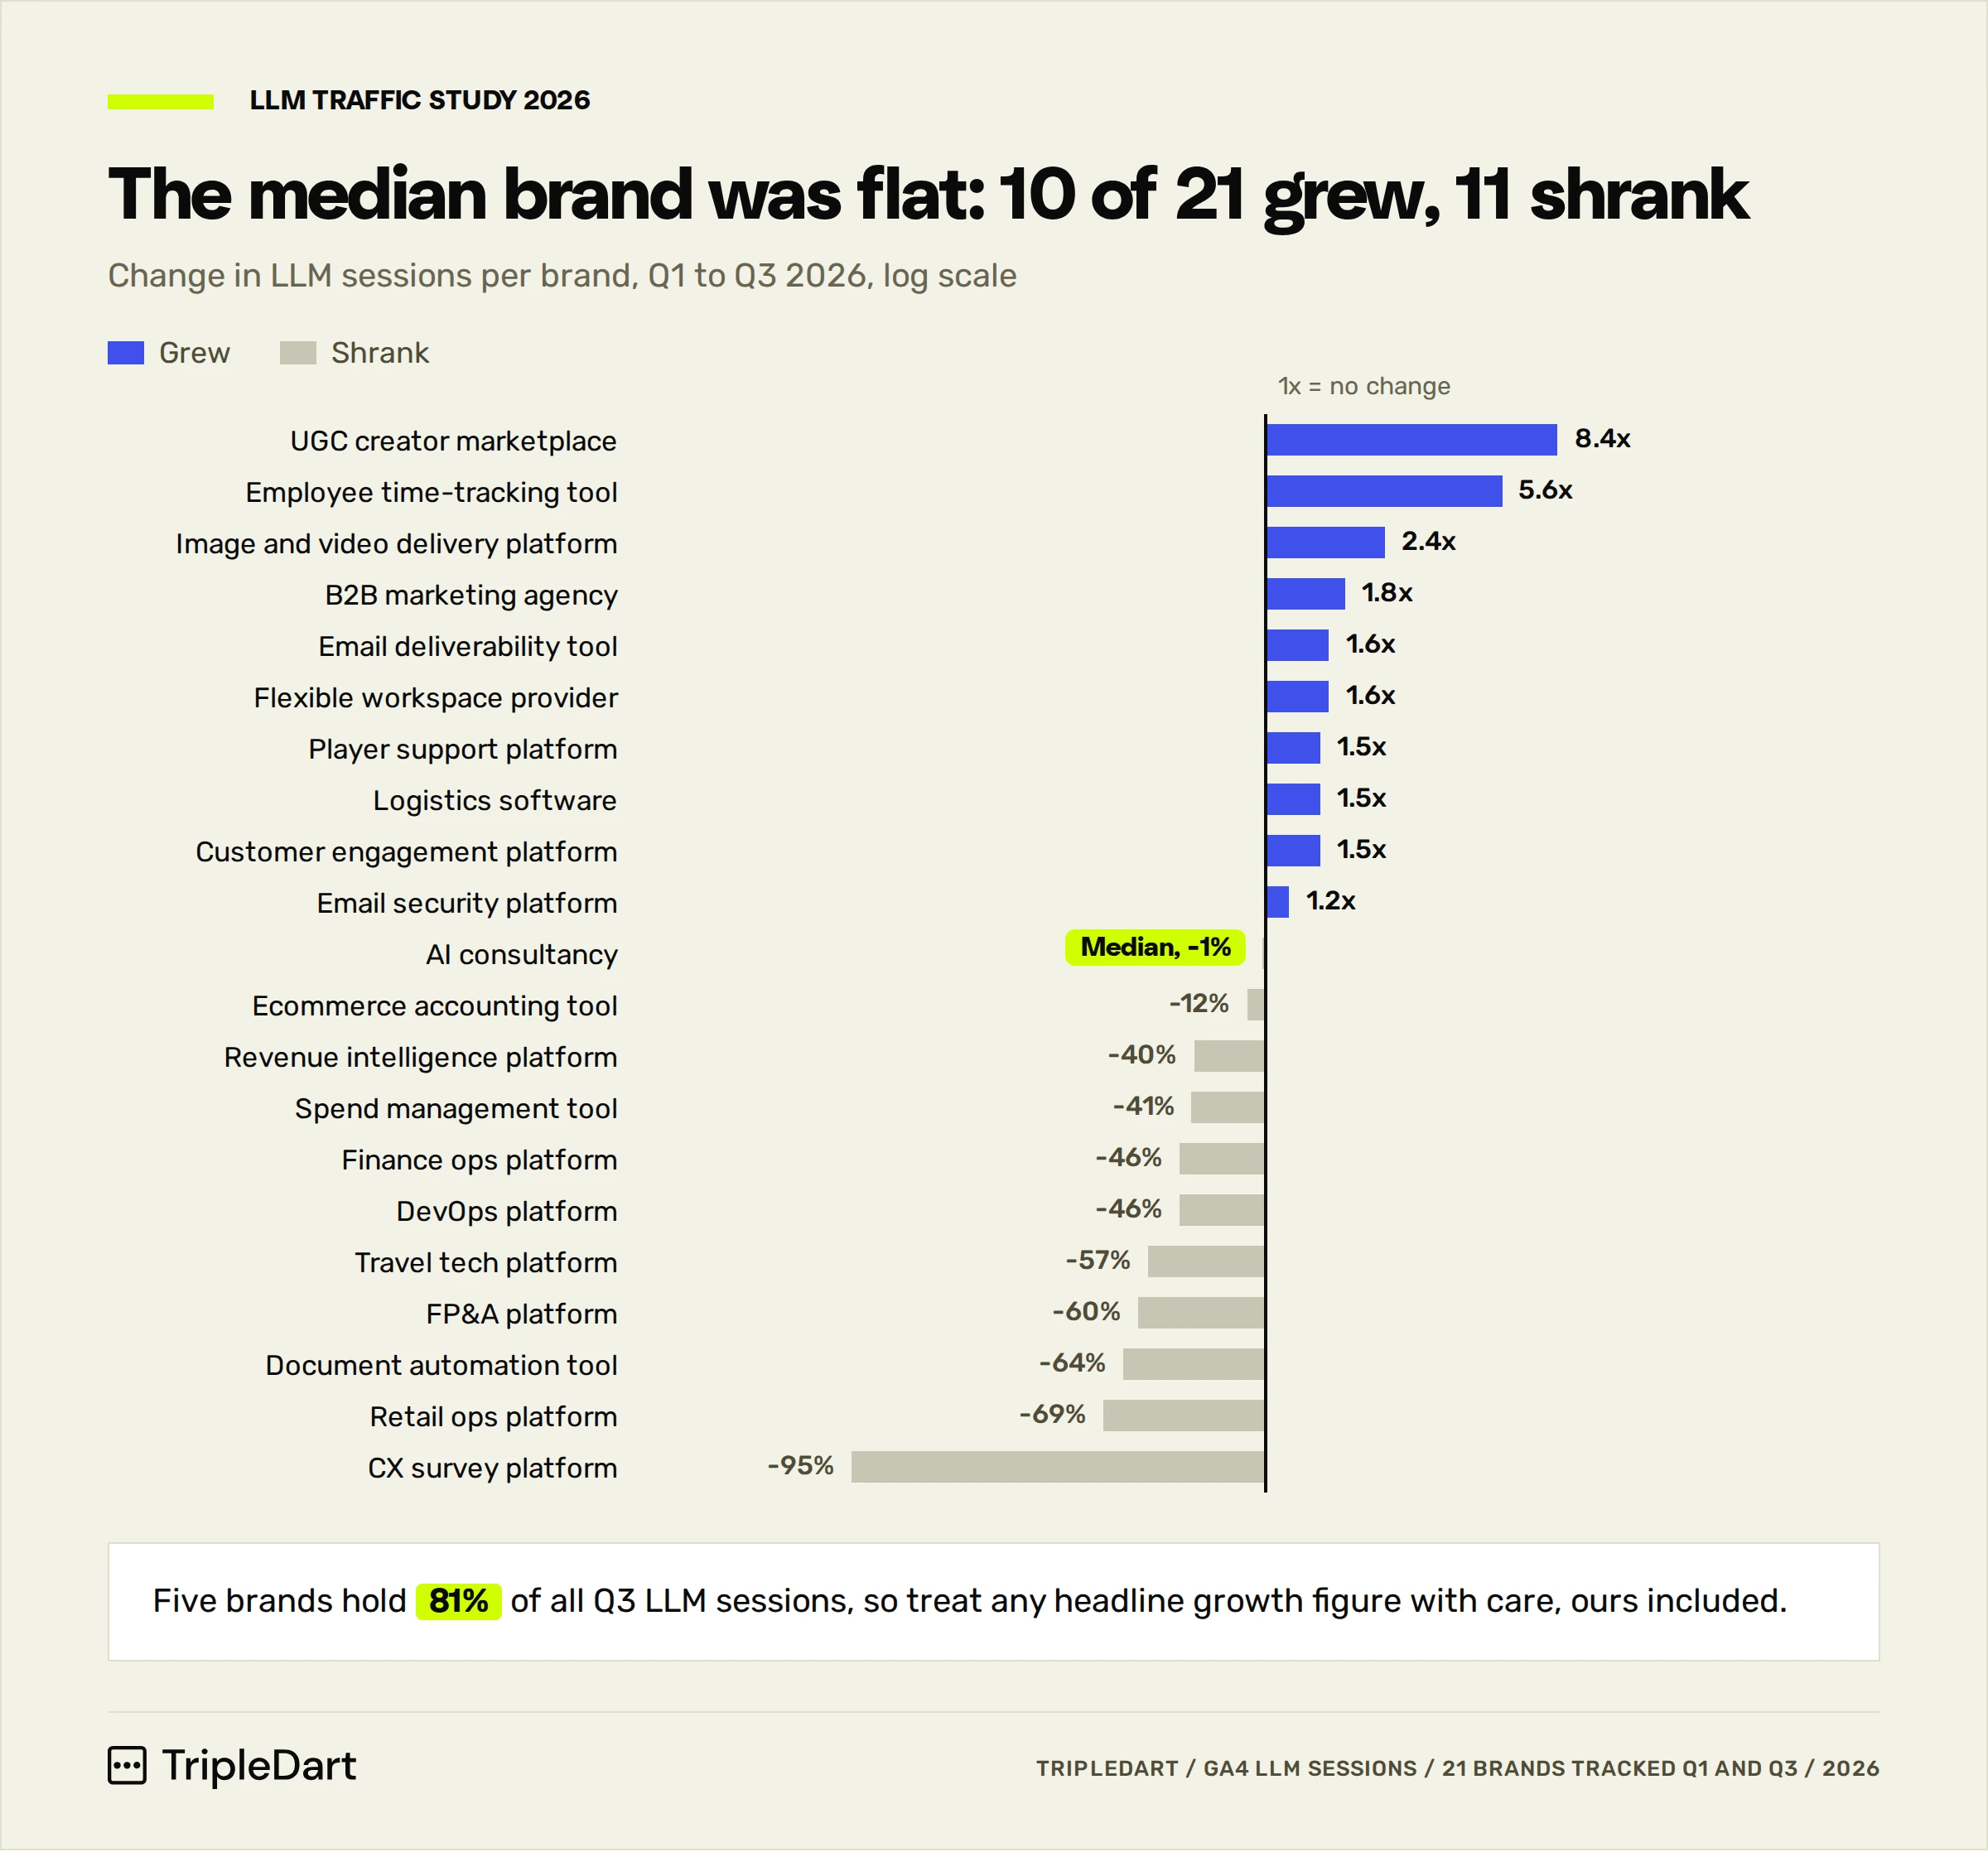
Across all 34 brands in Q3, the top five hold 81% of LLM sessions, and one payments and billing platform accounts for 38% alone. So be careful with any "AI traffic is up 3x" figure this quarter, ours included.
For a typical mid-sized SaaS brand in our set, LLM traffic held about steady. To size your own volume, our study shows LLM traffic as a share of organic traffic.
Your Q4 Checklist
If we had one B2B SaaS site to run for the next 90 days, this is the order we'd work in. Your constraints are probably different.
The basics of answer engine optimization still apply on every page, and this list sets which pages get the work first.
If you want this run on your own site, talk to our GEO team. We'll show you where your LLM sessions land today, which pages earn them and which posts have dropped out of the pool.
What This Study Can't Tell You
- Which pages produced pipeline. Every figure here is sessions, so it shows where visitors landed, not what they did next.
- Whether every session was a person. We removed one clearly automated pattern and can't rule out smaller ones.
- Exact blog formats for new posts. Sub-types for new URLs come from the slug, so the listicle and standard-post split is approximate.
- Anything beyond our portfolio. Thirty-four B2B SaaS brands are a small sample of the market, and five of them account for 81% of sessions. Treat it as a reference point for similar companies.
Frequently Asked Questions
Where Does ChatGPT Send Traffic on a B2B SaaS Website?
Mostly to the homepage, app and login pages, and the help center. Across all 34 brands in Q3, only 6% of ChatGPT sessions landed on a blog post. Its growth went to homepages (3.7x), app pages (6.9x) and help and docs (24x).
Why Is Blog Traffic From LLMs Falling?
In our data, blog traffic fell when the number of posts earning LLM sessions fell. That count and blog sessions moved with a correlation of 0.95 across 21 brands, and 60% of Q1's cited posts were no longer cited in Q3.
Which Page Types Earn the Most LLM Sessions per Page?
Pricing pages, with a median of 9 LLM sessions per page in Q3 2026, followed by help-center articles at 7. The median standard blog post earned 2, and comparison posts averaged about 2x a standard post.
Do Free Tools Still Get Traffic From AI Assistants?
Tools that check live data do. An email security platform's checkers grew 85%. Converters and templates that an assistant can copy in the chat fell 35% to 100%, and free tools overall fell 24%.
Which AI Platform Sends the Most Blog Traffic?
ChatGPT sends the most blog sessions by volume because it sends the most of everything. Gemini sends the highest share, with 17% of its Q3 sessions landing on blog posts against 6% for ChatGPT.
How Much Did LLM Traffic Grow for B2B SaaS in 2026?
LLM sessions to the 21 B2B SaaS brands we tracked in both Q1 and Q3 2026 grew 2.4x, from 47,198 to 115,464. The median brand grew 0.99x, so a few brands drove most of that growth.
Did Perplexity Traffic Drop in 2026?
In our data, Perplexity sessions fell 62% between Q1 and Q3 2026, and the drop showed up in 19 of 21 brands. A drop that uniform often reflects tracking changes, so wait for Q4 before acting on it.